Welcome to this week’s Math Munch!
A few weeks ago, I learned about an amazing woman named Marjorie Rice. Marjorie is a mathematician – but with a very unusual background.

 Marjorie had no mathematical education beyond high school. But, Marjorie was always interested in math. When her children were all in school, Marjorie began to read about and work on math problems for fun. Her son had a subscription to Scientific American, and Marjorie enjoyed reading articles by Martin Gardner (of hexaflexagon fame). One day in 1975, she read an article that Martin Gardner wrote about a new discovery about pentagon tessellations. Before several years earlier, mathematicians had believed that there were only five different types of pentagons that could tessellate – or cover the entire plane without leaving any gaps. But, in 1968, three more were discovered, and, in 1975, a fourth was found – which Martin Gardner reported on in his article.
 When she read about this, Marjorie became curious about whether she could find her own new type of pentagon that could tile the plane. So, she got to work. She came up with her own notation for the relationships between the angles in her pentagons. Her new notation helped her to see things in ways that professional mathematicians had overlooked. And, eventually… she found one! Marjorie wrote to Martin Gardner to tell him about her discovery. By 1977, Marjorie had discovered three more types of pentagons that tile the plane and her new friend, the mathematician Doris Schattschneider, had published an article about Marjorie’s work in Mathematics Magazine.
 There are now fourteen different types of pentagons known to tile the plane… but are there more? No one knows for sure. Whether or not there are more types of pentagons that tile the plane is what mathematicians call an open problem. Maybe you can find a new one – or prove that one can’t be found!
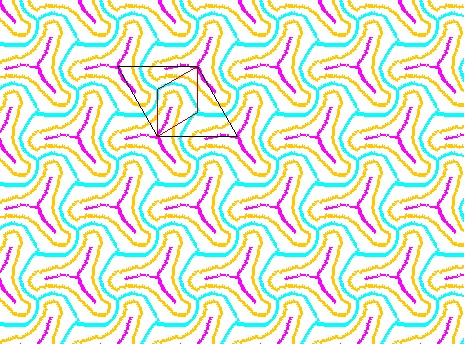
Marjorie has a website called Intriguing Tessellations on which she’s written about her work and posted some of her tessellation artwork. Here is one of her pentagon tilings transformed into a tessellation of fish.
By the way, it was Marjorie’s birthday a few weeks ago. She just turned 90 years old. Happy Birthday, Marjorie!
 Next up, I just ran across a great blog called Wild About Math! This blog is written by Sol Lederman, who used to work with computers and LOVES math. My favorite part about this blog is a series of interviews that Sol calls, “Inspired by Math.” Sol has interviewed about 23 different mathematicians, including Steven Strogatz (who has written two series of columns for the New York Times about mathematics) and Seth Kaplan and Deno Johnson, the producer and writer/director of the Flatland movies. You can listen to Sol’s podcasts of these interviews by visiting his blog or iTunes. They’re free – and very interesting!
 Finally, what New York City resident or visitor isn’t fascinated by the subway system? And what New York City resident or visitor doesn’t spend a good amount of time thinking about the fastest way to get from point A to point B? Do you stay on the same train for as long as possible and walk a bit? Or do you transfer, and hope that you don’t miss your train?

Chris and Matt, on the subway.
Well, in 2009, two mathematicians from New York – Chris Solarz and Matt Ferrisi – used a type of mathematics called graph theory to plan out the fastest route to travel the entire New York City subway system, stopping at every station. They did the whole trip in less than 24 hours, setting a world record! Graph theory is the branch of mathematics that studies the connections between points or places. In their planning, Chris and Matt used graph theory to find a route that had the most continuous travel, minimizing transfers, distance, and back-tracking. You can listen to their fascinating story in an interview with Chris and Matt done by the American Mathematical Society here.
If you’re interested in how graph theory can be used to improve the efficiency of a subway system, check out this article about the Berlin subway system (the U-bahn). Students and professors from the Technical University Berlin used graph theory to create a schedule that minimized transfer time between trains. If only someone would do this in New York…
Bon appetit!