Tag Archives: interview

SquareRoots, Concave States, and Sea Ice

Welcome to this week’s Math Munch!

The most epic Pi Day of the century will happen in just a few weeks: 3/14/15! I hope you’re getting ready. To help you get into the spirit, check out these quilts.
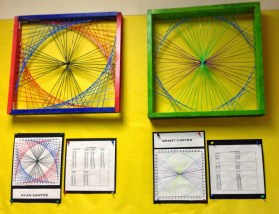
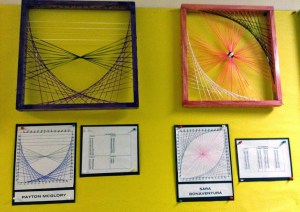
American Pi.

American Pi.

African American Pi.

African American Pi.

There’s an old joke that “pi is round, not square”—a punchline to the formula for the area of a circle. But in these quilts, we can see that pi really can be square! Each quilt shows the digits of pi in base 3. The quilts are a part of a project called SquareRoots by artist and mathematician John Sims.
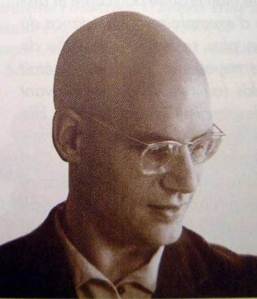
John Sims.

John Sims.

There’s lots more to explore and enjoy on John’s website, including a musical interpretation of pi and some fractal trees that he has designed. John studied mathematics as an undergrad at Antioch College and has pursued graduate work at Wesleyan University. He even created a visual math course for artists when he taught at the Ringling College of Art and Design in Florida.

I enjoyed reading several articles (1, 2, 3, 4) about John and his quilts, as well as this interview with John. Here’s one of my favorite quotes from it, in response to “How do you begin a project?”

It can happen in two ways. I usually start with an object, which motivates an idea. That idea connects to other objects and so on, and, at some point, there is a convergence where idea meets form. Or sometimes I am fascinated by an object. Then I will seek to abstract the object into different spatial dimensions.

simstrees

Cellular Forest and Square Root of a Tree, by John Sims.

You can find more of John’s work on his YouTube channel. Check out this video, which features some of John’s music and an art exhibit he curated called Rhythm of Structure.

Next up: Some of our US states are nice and boxy—like Colorado. (Or is it?) Other states have very complicated, very dent-y shapes—way more complicated than the shapes we’re used to seeing in math class.

Which state is the most dent-y? How would you decide?

3fe3acace86442e7a0ddf5c7369f14dc.480x480x351

West Virginia is pretty dent-y. By driving “across” it, you can pass through many other states along the way.

The mathematical term for dent-y is “concave”. One way you might try to measure the concavity of a state is to see how far outside of the state you can get by moving in a straight line from one point in it to another. For example, you can drive straight from one place in West Virginia to another, and along the way pass through four other states. That’s pretty crazy.

But is it craziest? Is another state even more concave? That’s what this study set out to investigate. Click through to find out their results. And remember that this is just one way to measure how concave a state is. A different way of measuring might give a different answer.

Awesome animal kingdom gerrymandering video!

Awesome animal kingdom gerrymandering video!

This puzzle about the concavity of states is silly and fun, but there’s more here, too. Thinking about the denty-ness of geographic regions is very important to our democracy. After all, someone has to decide where to draw the lines. When regions and districts are carved out in a way that’s unfair to the voters and their interests, that’s called gerrymandering.

Karen Saxe

Karen Saxe.

To find out more about the process of creating congressional districts, you can listen to a talk by Karen Saxe, a math professor at Macalester College. Karen was a part of a committee that worked to draw new congressional districts in Minnesota after the 2010 US Census. (Karen speaks about compactness measures starting here.)

Recently I ran across an announcement for a conference—a conference that was all about the math of sea ice! I never grow tired of learning new and exciting ways that math connects with the world. Check out this video featuring Kenneth Golden, a leading mathematician in the study of sea ice who works at the University of Utah. I love the line from the video: “People don’t usually think about mathematics as a daring occupation.” Ken and his team show that math can take you anywhere that you can imagine.

Bon appetit!

Reflection sheet – SquareRoots, Concave States, and Sea Ice

Nice Neighbors, Spinning GIFs, and Breakfast

A minimenger.

A minimenger.

Welcome to this week’s Math Munch!

Math projects are exciting—especially when a whole bunch of people work together. One example of big-time collaboration is the GIMPS project, where anyone can use their computer to help find the next large prime number. Another is the recent MegaMenger project, where people from all over the world helped to build a giant 3D fractal.

But what if I told you that you can join up with others on the internet to discover some brand-new math by playing a webgame?

Chris Staecker is a math professor at Fairfield University. This past summer he led a small group of students in a research project. Research Experiences for Undergraduates—or REUs, as they’re called—are summer opportunities for college students to be mentored by professors. Together they work to figure out some brand-new math.

The crew from last summer's REU at Fairfield. Chris is furthest in the back.

The crew from last summer’s REU at Fairfield. Chris is furthest in the back.

The irreducible digital images containing 1, 5, 6, and 7 points.

The irreducible digital images containing 1, 5, 6, and 7 “chunks”.

Chris and his students Jason Haarmann, Meg Murphy, and Casey Peters worked on a topic in graph theory called “digital images”. Computer images are made of discrete chunks, but we often want to make them smaller—like with pixel art. So how can we make sure that we can make them smaller without losing too much information? That’s an important problem.

Now, the pixels on a computer screen are in a nice grid, but we could also wonder about the same question on an arbitrary connected network—and that’s what Chris, Jason, Meg, and Casey did. Some networks can be made smaller through one-step “neighbor” moves while still preserving the correct connection properties. Others can’t. By the end of the summer, the team had come up with enough results about digital images with up to eight chunks to write about them in a paper.

To help push their research further, Chris has made a webgame that takes larger networks and offers them as puzzles to solve. Here’s how I solved one of them:

NiceNeighbors

See how the graph “retracts” onto itself, just by moving some of the nodes on top of their neighbors? That’s the goal. And there are lots of puzzles to work on. For many of them, if you solve them, you’ll be the first person ever to do so! Mathematical breakthrough! Your result will be saved, the number at the bottom of the screen will go up by one, and Chris and his students will be one step closer to classifying unshrinkable digital images.

Starting with the tutorial for Nice Neighbors is a good idea. Then you can try out the unsolved experimental puzzles. If you find success, please let us know about in the comments!

Do you have a question for Chris and his students? Then send it to us and we’ll try to include it in our upcoming Q&A with them.


Next up: you probably know by now that at Math Munch, we just can’t get enough of great mathy gifs. Well, Sumit Sijher has us covered this week, with his Tumblr called archery.

Here are four of Sumit’s gifs. There are plenty more where these came from. This is a nice foursome, though, because they all spin. Click to see the images full-sized!

tumblr_mdv99p6WcP1qfjvexo1_500

How many different kinds of cubes can you spot?

This one reminds me of the Whitney Music Box.

This one reminds me of the
Whitney Music Box.

Whoa.

Clockwise or counterclockwise?

Clockwise or counterclockwise?

I really appreciate how Sumit also shares the computer code that he uses to make each image. It gives a whole new meaning to “show your work”!

Through Sumit’s work I discovered that WolframAlpha—an online calculator that is way more than a calculator—has a Tumblr, too. By browsing it you can find some groovy curves and crazy estimations. Sumit won an honorable mention in Wolfram’s One-Liner Competition back in 2012. You can see his entry in this video.

And now for the most important meal of the day: breakfast. Mathematicians eat breakfast, just like everyone else. What do mathematicians eat for breakfast? Just about any kind of breakfast you might name. For some audio-visual evidence, here’s a collection of sound checks by Numberphile.

Sconic sections. Yum!

Sconic sections. Yum!

If that has you hungry for a mathematical breakfast, you might enjoy munching on some sconic sectionsa linked-to-itself bagel, or some spirograph pancakes.

Bon appetit!

Grothendieck, Circle Packing, and String Art

Welcome to this week’s Math Munch!

Grothendieckportra_3107171cThis week brought some sad news to the mathematical world. Alexander Grothendieck, known by many as the greatest mathematician of the past century, passed away on November 13th. You may not have heard of him, but many mathematicians say that the work he did in math was as influential as the work Albert Einstein did in physics.

One of the things that make Grothendieck so interesting is, of course, the math he did. Grothendieck was always very creative. When he was in high school, he preferred to do math problems he made up on his own over the problems assigned by his teacher. “These were the book’s problems, and not my problems,” he said.

When he was young, inspired by some gaps he found in definitions in his geometry book about measuring lengths and areas, Grothendieck re-created some of the most important mathematical ideas of the beginning of the twentieth century. Maybe this sounds silly to you– why re-invent something that’s already been done? But, to Grothendieck, the most important part was that he’d done the whole thing by himself. He’d figured out something in his own way. He later wrote that this experience showed him what being a mathematician was like:

Without having been told, I nevertheless knew ‘in
my gut’ that I was a mathematician: someone who
‘does’ math, in the fullest sense of the word…

During his years as a mathematician, Grothendieck worked on connecting different parts of math (a project requiring a lot of creativity)– algebra, geometry, topology, and calculus, among others.

Grothendieck kid

Alexander Grothendieck as a kid

The other thing that makes Grothendieck so interesting is his life story. As a kid, Grothendieck and his parents fled from Germany to France to escape the Nazis. As an adult, Grothendieck spoke out strongly for peace. He used his fame to take a stand against the wars of the second half of the twentieth century. This eventually led him to step away from the world of mathematicians– which many regretted. But he left behind work that changed all of mathematics for the better.

If you’d like to learn more about Grothendieck’s fascinating life and work, check out this great (but long) article from the American Mathematical Society. This article provides a shorter history, including a great statement Grothendieck made about his feelings on creativity in mathematics. Grothendieck was a very private person, so many of his mathematical writings aren’t available online– but the Grothendieck Circle has done their best to collect everything written about him.

Fractal-Apollonian-Gasket-Variations-02

A pretty circle packing

Next up, a little something for you to play with! We were studying circle packing problems in one of my classes this week. Did you know that you can fit exactly six circles snugly around another circle of the same size? But, if you try to fit circles snugly around a circle twice as large, it doesn’t work? I wonder why that is…


I did it!

I did it!

Anyway, my class inspired me to look for a circle packing game– and I found one! In this game, simply called Circle Packing, you have to fit all of the smaller circles into the larger circle– without any of them touching! It’s pretty tricky, and really fun.

String art wall long

String art circleFinally, the Math Munch team got something wonderful in the mail (email, I guess) this week! Math art made by Julia Dweck’s 5th grade math class! Julia’s class has been working hard to make parabolic curve string art– curves made by drawing (or stringing, in this case) many, many straight lines. They plotted each curve precisely before stringing it, to make sure it was both mathematically and artistically perfect. The pieces they made are so creative and beautiful. We’re proud to feature them on our site!

String art parabolaYou can see the whole collection of string art pieces made by Julia’s class on our Readers’ Gallery String Art page. And, want to know more about how the 5th graders made their String Art? Have any questions for Julia and her students about their love of math and the connections they see between math and art? Write your questions here and we’ll send them to Julia’s students!

Have any math art of your own? Send it to mathmunchteam@gmail.com, and we’ll post it in the Readers’ Gallery!

Bon appetit!