Tag Archives: circles

SET, Ptolemy, and Malin Christersson

Welcome to this week’s Math Munch!

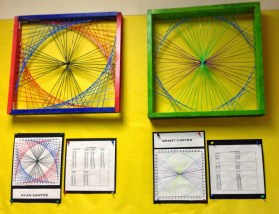
To set up the punchline: if you haven’t played the card game SET before, do yourself a favor and go try it out now!

(Or if you prefer, here’s a video tutorial.)

ThereAreNoSetsHere

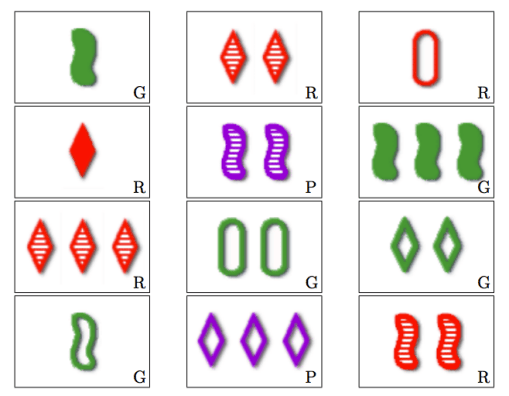
Are there any sets to be found here?

(And even if you have played before, go ahead and indulge yourself with a round. You deserve a SET break. 🙂 )

Now, we’ve shared about SET before, but recently there has been some very big SET-related news. Although things have been quieter around Georgia Tech since summer has started, there has been a buzz both here and around the internet about a big breakthrough by Vsevolod Lev, Péter Pál Pach, and Georgia Tech professor Ernie Croot. Together they have discovered a new approach to estimate how big a SET-less collection of SET cards can be.

In SET there are a total of 81 cards, since each card expresses one combination of four different characteristics (shape, color, filling, number) for which there are three possibilities each. That makes 3^4=81 combinations of characteristics. Of these 81 cards, what do you think is the most cards we could lay out without a SET appearing? This is not an easy problem, but it turns out the answer is 20. An even harder problem, though, is asking the same question but for bigger decks where there are five or ten or seventy characteristics—and so 3^5 or 3^10 or 3^70 cards. Finding the exact answer to these larger problems would be very, very hard, and so it would be nice if we could at least estimate how big of a collection of SET-less cards we could make in each case. This is called the cap set problem, and Vsevolod, Péter, and Ernie found a much, much better way to estimate the answers than what was previously known.

To find out more on the background of the cap set problem, check out this “low threshold, high ceiling” article by Michigan grad student Charlotte Chan. And I definitely encourage you to check out this article by Erica Klarreich in Quanta Magazine for more details about the breakthrough and for reactions from the mathematical community. Here’s a choice quote:

Now, however, mathematicians have solved the cap set problem using an entirely different method — and in only a few pages of fairly elementary mathematics. “One of the delightful aspects of the whole story to me is that I could just sit down, and in half an hour I had understood the proof,” Gowers said.

(For further wonderful math articles, you’ll want to visit Erica’s website.)

 Vsevolod  Peter  Ernie
 Charlotte  Erica  Marsha

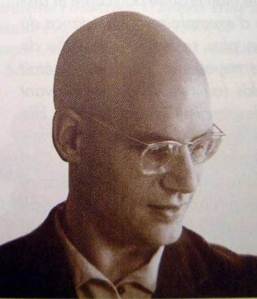
These are photos of Vsevolod, Péter, Ernie, Charlotte, Erica, and the creator of SET, geneticist Marsha Jean Falco.

Ready for more? Earlier this week, I ran across this animation:

tumblr_o0k7mkhNSN1uk13a5o1_500

It shows two ways of modeling the motions of the sun and the planets in the sky. On the left is a heliocentric model, which means the sun is at the center. On the right is a geocentric model, which means the earth is at the center.

suntriangle

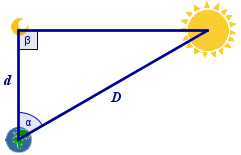
Around 250 BC, Aristarchus calculated the size of the sun, and decided it was too big to revolve around the earth!

Now, I’m sure you’ve heard that the sun is at the center of the solar system, and that the earth and the planets revolve around the sun. (After all, we call it a “solar system”, don’t we?) But it took a long time for human beings to decide that this is so.

I have to confess: I have a soft spot for the geocentric model. I ran across the animation in a Facebook group of some graduates of St. John’s College, where I studied as an undergrad. We spent a semester or so reading Ptolemy’s Almagest—literally, the “Great Work”—on the geocentric model of the heavens. It is an incredible work of mathematics and of natural science. Ptolemy calculated the most accurate table of chords—a variation on a table of the sine function—that existed in his time and also proved intricate facts about circular motion. For example, here’s a video that shows that the eccentric and epicyclic models of solar motion are equivalent. What’s really remarkable is that not only does Ptolemy’s system account for the motions of the heavenly bodies, it actually gave better predictions of the locations of the planets than Copernicus’s heliocentric system when the latter first debuted in the 1500s. Not bad for something that was “wrong”!

Here are Ptolemy and Copernicus’s ways of explaining how Mars appears to move in the sky:

ptolemy Copernicus_Mars

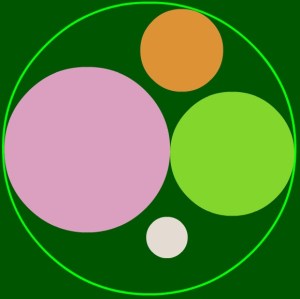
Maybe you would like to learn more about the history of models of the cosmos? Or maybe you would like tinker with a world-system of your own? You might notice that the circles-on-circles of Ptolemy’s model are just like a spirograph or a roulette. I wonder what would happen if we made the orbit circles in much different proportions?

Malin

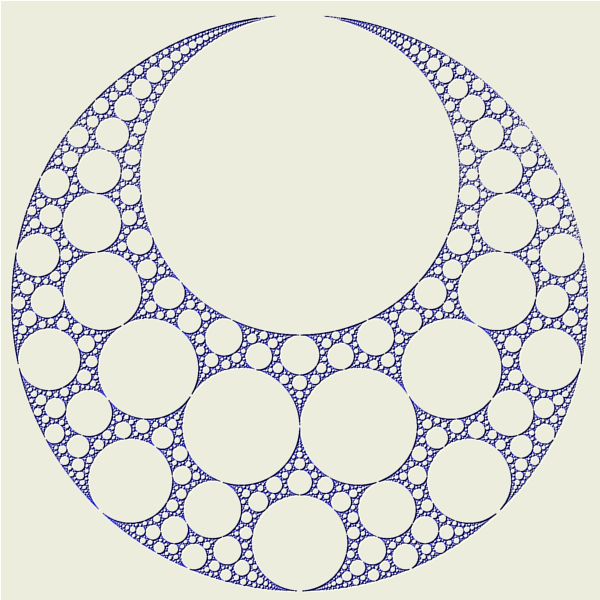
Malin, tiled hyperbolically.

Now, I was very glad to take this stroll down memory lane back to my college studies, but little did I know that I was taking a second stroll as well: the person who created this great animation, I had run across several other pieces of her work before! Her name is Malin Christersson and she’s a PhD student in math education in Sweden. She is also a computer scientist who previously taught high school and also teaches many people about creating math in GeoGebra. You can try out her many GeoGebra applets here. Malin also has a Tumblr where she posts gifs from the applets she creates.

About a year ago I happened across an applet that lets you create art in the style of artist (and superellipse creator) Piet Mondrian. But it also inverts your art—reflects it across a circle—so that you can view your own work from a totally different perspective. Then just a few months later I delighted in finding another applet where you can tile the hyperbolic plane with an image of your choice. (I used one tiling I produced as my Twitter photo for a while.)

Mondrian

Mondrainverted.

tiling (4)

Me, tiled hyperbolically.

And now come to find out these were both made by Malin, just like the astronomy animation above! And Malin doesn’t stop there, no, no. You should see her fractal applets depicting Julia sets. And her Rolling Hypocycloids and Epicycloids are can’t-miss. (Echoes of Ptolemy there, yes?!)

And please don’t miss out on Malin’s porfolio of applets made in the programming language Processing.

It’s a good feeling to finally put the pieces together and to have a new mathematician, artist, and teacher who inspires me!

I hope you’ll find some inspiration, too. Bon appetit!

Grothendieck, Circle Packing, and String Art

Welcome to this week’s Math Munch!

Grothendieckportra_3107171cThis week brought some sad news to the mathematical world. Alexander Grothendieck, known by many as the greatest mathematician of the past century, passed away on November 13th. You may not have heard of him, but many mathematicians say that the work he did in math was as influential as the work Albert Einstein did in physics.

One of the things that make Grothendieck so interesting is, of course, the math he did. Grothendieck was always very creative. When he was in high school, he preferred to do math problems he made up on his own over the problems assigned by his teacher. “These were the book’s problems, and not my problems,” he said.

When he was young, inspired by some gaps he found in definitions in his geometry book about measuring lengths and areas, Grothendieck re-created some of the most important mathematical ideas of the beginning of the twentieth century. Maybe this sounds silly to you– why re-invent something that’s already been done? But, to Grothendieck, the most important part was that he’d done the whole thing by himself. He’d figured out something in his own way. He later wrote that this experience showed him what being a mathematician was like:

Without having been told, I nevertheless knew ‘in
my gut’ that I was a mathematician: someone who
‘does’ math, in the fullest sense of the word…

During his years as a mathematician, Grothendieck worked on connecting different parts of math (a project requiring a lot of creativity)– algebra, geometry, topology, and calculus, among others.

Grothendieck kid

Alexander Grothendieck as a kid

The other thing that makes Grothendieck so interesting is his life story. As a kid, Grothendieck and his parents fled from Germany to France to escape the Nazis. As an adult, Grothendieck spoke out strongly for peace. He used his fame to take a stand against the wars of the second half of the twentieth century. This eventually led him to step away from the world of mathematicians– which many regretted. But he left behind work that changed all of mathematics for the better.

If you’d like to learn more about Grothendieck’s fascinating life and work, check out this great (but long) article from the American Mathematical Society. This article provides a shorter history, including a great statement Grothendieck made about his feelings on creativity in mathematics. Grothendieck was a very private person, so many of his mathematical writings aren’t available online– but the Grothendieck Circle has done their best to collect everything written about him.

Fractal-Apollonian-Gasket-Variations-02

A pretty circle packing

Next up, a little something for you to play with! We were studying circle packing problems in one of my classes this week. Did you know that you can fit exactly six circles snugly around another circle of the same size? But, if you try to fit circles snugly around a circle twice as large, it doesn’t work? I wonder why that is…


I did it!

I did it!

Anyway, my class inspired me to look for a circle packing game– and I found one! In this game, simply called Circle Packing, you have to fit all of the smaller circles into the larger circle– without any of them touching! It’s pretty tricky, and really fun.

String art wall long

String art circleFinally, the Math Munch team got something wonderful in the mail (email, I guess) this week! Math art made by Julia Dweck’s 5th grade math class! Julia’s class has been working hard to make parabolic curve string art– curves made by drawing (or stringing, in this case) many, many straight lines. They plotted each curve precisely before stringing it, to make sure it was both mathematically and artistically perfect. The pieces they made are so creative and beautiful. We’re proud to feature them on our site!

String art parabolaYou can see the whole collection of string art pieces made by Julia’s class on our Readers’ Gallery String Art page. And, want to know more about how the 5th graders made their String Art? Have any questions for Julia and her students about their love of math and the connections they see between math and art? Write your questions here and we’ll send them to Julia’s students!

Have any math art of your own? Send it to mathmunchteam@gmail.com, and we’ll post it in the Readers’ Gallery!

Bon appetit!

Making Pi, Transcending Pi, and Cookies

Welcome to this week’s Math Munch– and happy Pi Day!

What does pi look like? The first 10,000 digits of pi, each digit 0 through 9 assigned a different color.

You probably know some pretty cool things about the number pi. Perhaps you know that pi has quite a lot to do with circles. Maybe you know that the decimal expansion for pi goes on and on, forever and ever, without repeating. Maybe you know that it’s very likely that any string of numbers– your birthday, phone number, all the birthdays of everyone you know listed in a row, followed by all their phone numbers, ANYTHING– can be found in the decimal expansion of pi.

But did you know that pi can be approximated by dropping needles on a piece of paper? Well, it can! If you drop a needle again and again on a lined piece of paper, and the needle is the same length as the distance between the lines, the probably that the needle lands on a line is two divided by pi. This experiment is called Buffon’s needle, after the French naturalist Buffon.

If the angle the needle makes with the lines is in the gray area (like the red needle’s angle is), it will cross the line. If the angle isn’t, it won’t. The possible angles trace out a circle. The closer the center of the needle (or center of the circle) is to the line, the larger the gray area– and the higher the probability of the needle hitting the line.

This may seem strange to you– but if you think about how the needle hitting a line has a lot to do with the distance between the middle of the needle and the nearest line and the angle it makes with the lines, maybe you’ll start to think about circles… and then you’ll get a clue about the connection between this experiment and pi. Working out this probability exactly requires some pretty advanced mathematics. (Feeling ambitious? Read about the calculation here.) But, you can get some great experimental results using this Buffon’s needle applet.

Click on the picture to try the applet.

Click on the picture to try the applet.

I had the applet drop 500 needles. Then, the applet used the fact that the probability of the needle hitting a line should be two divided by pi and the probability it measured to calculate an approximation for pi. It got… well, you can see in the picture. Pretty close, right?

Here’s another thing you might not know: pi is a transcendental number. Sounds trippy– but, like some other famous numbers with letter names, like e, pi can never be the solution to an algebraic equation involving whole numbers. That means that no matter what equation you give me– no matter how large the exponent, how many negatives you toss in, how many times you multiply or divide by a whole number– pi will never, ever be a solution. Maybe this doesn’t sound amazing to you. If not, check out this video from Numberphile about transcendental numbers. Numbers like pi and e don’t do mathematical things we’re used to numbers doing… and it’s pretty weird.

Still curious about transcendental numbers? Here’s a page listing the fifteen most famous transcendental numbers. My favorite? Definitely the fifth, Liouville’s number, which has a 1 in each consecutive factorial numbered place.

Escher cookies 1Finally, maybe you don’t like pi. Maybe you like cookies instead. Lucky for you, you can do many mathematical things with cookies, too. Like make cookie tessellations! This mathematical artist and baker made cookie cutters in the shapes of tiles from Escher tessellations and used them to make mathematical cookie puzzles. Beautiful, and certainly delicious.

If you happen to have a 3D printer, you can make your own Escher cookie cutters. Here’s a link to print out the lizard cutter. If you don’t have a 3D printer, you could try printing out a 2D image of an Escher tessellation and tracing a tile onto a sheet of paper. Cut out the tile, roll out your dough, and slice around the outside of the tile to make your cookies. If you do it right, you shouldn’t have to waste any dough…

Here’s hoping you eat some pi or cookies on pi day! Bon appetit!