Welcome to this week’s Math Munch!
Update: A few weeks ago we met Dearing Wang, mathematical artist and creator of Dearing Draws. Now you can read a Math Munch Q&A with Dearing Wang.
OK, first up in this week’s post, do you remember when we talked about the six dimensions of color and the RGB color system? Well either way, consider this:

Artist Tauba Auerbach (one of my absolute favorite contemporary artists) made a book that contains every possible color!!! Tauba calls it “The RGB Colorspace Atlas.” The book is a perfect 8″ by 8″ by 8″ cube, matching the classic RGB color cube.
 The primary colors of light (red, blue, and green) increase as you move in each of the three directions. This leaves white and black at opposite corners of the cube, and all the wonderful colors spread around throughout the cube, with the primary and secondary colors on the other corners. You can read more here, if you like.
The book shows cross-sections moving through a single axis, so Tauba really had 3 choices for how the pages should flip through the cube. In fact, she made all three books! Jonathan Turner made simulations of all three axes however, so we can see each one if we like. Can you tell which one is open in the pictures above?
That’s the Red Axis. Compare that to the Green Axis and Blue Axis.
For computer graphics, RGB color codes are ordered triples of numbers like (120, 15, 28). Each number says how much of each color should be included in the mix. There are 256 possible values for each one, with values from 0 to 255. [Examples: (0,0,0) is black. (255,255,255) is white. (255,0,0) is red. (127,0,0) is a red that’s half as bright.] Since there are only so many number combinations, computers have exactly 16,777,216 possible colors. That’s where allRGB comes in.
 Starry Night |
 Hilbert Coloring |
 Escher LIzards |
As they say, “The objective of allRGB is simple: To create images with one pixel for every RGB color (16777216); not one color missing, and not one color twice.” AllRGB is a bounded concept, since there are only finitely many ways to rearrange those 16777216 pixels. But of course there are a HUUUUGGGEEEE number of ways to rearrange them, so there’s lots to see. (In fact if you wrote a 1 with 100 million zeroes after it, that number would still be smaller than the number of allRGB pictures!! And that’s only part of the story) Click the pictures above for zoomable versions as well as descriptions of their creation.
 |
 |
We’ve posted a little before about hyperbolic geometry. Very very briefly, the hyperbolic plane is a 2D surface where some of our usual intuition gets a little warped. For example, two lines can be parallel to the same line but not parallel to each other, which seems a little awkward. Click the images above to really experience what it’s like to walk through a hyperbolic world. David Madore created these hyperbolic “mazes,” which give you a birds eye view as you walk through a strange new land.
Finally, you might enjoy this old Numberplay puzzle with a hyperbolic feel, based on the movements of whales.
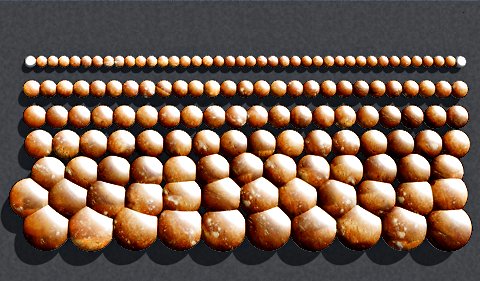
Gary Antonick asks “What is the fewest-bun path between the two white buns? (The two white buns are the first and last — or 40th — buns in the top row.”
What do buns have to do with whales and hyperbolic geometry? You’ll just have to click and find out.
Have a great week and bon appetit!

The Colorspace Atlas is beautiful, and very interesting. I would love to know how it was created, what it will be used for, and whether or not the concepts of it could be applied to digital art.
How do you know you have every color possible? How did you find all the colors?