Tag Archives: recreational mathematics

Temari, Function Families, and Clapping Music

Welcome to this week’s Math Munch!

Carolyn Yackel

Carolyn Yackel

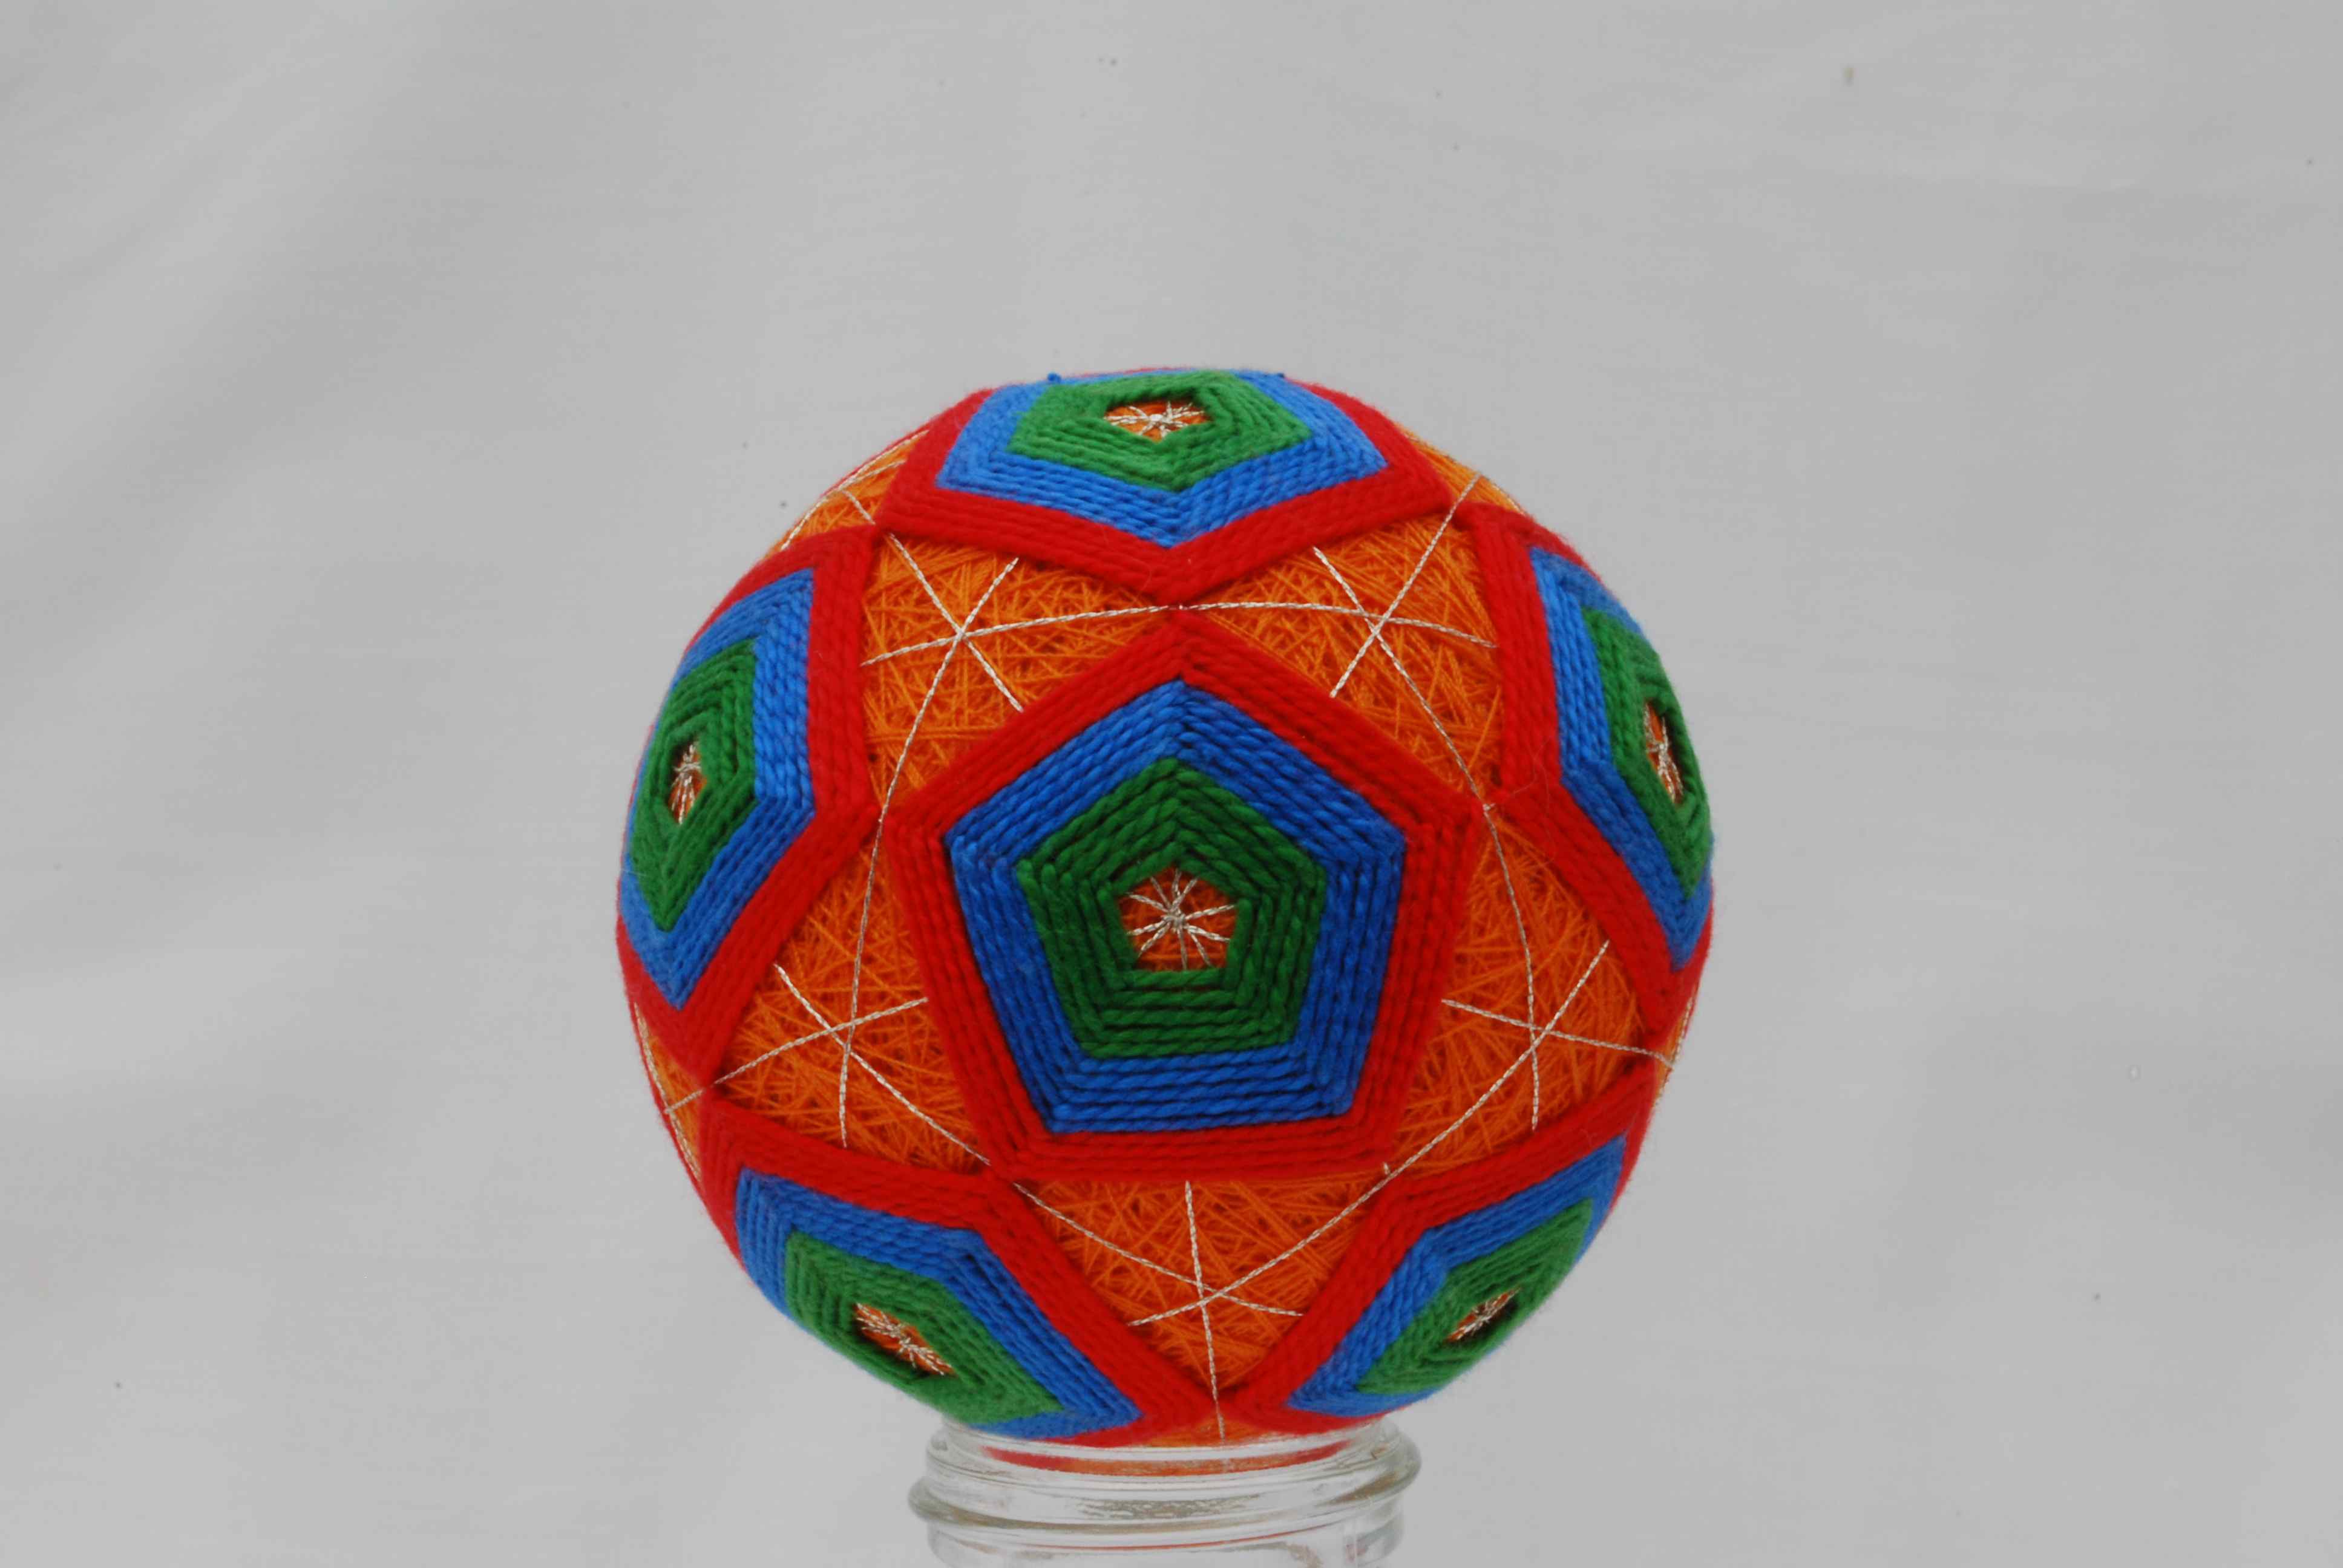
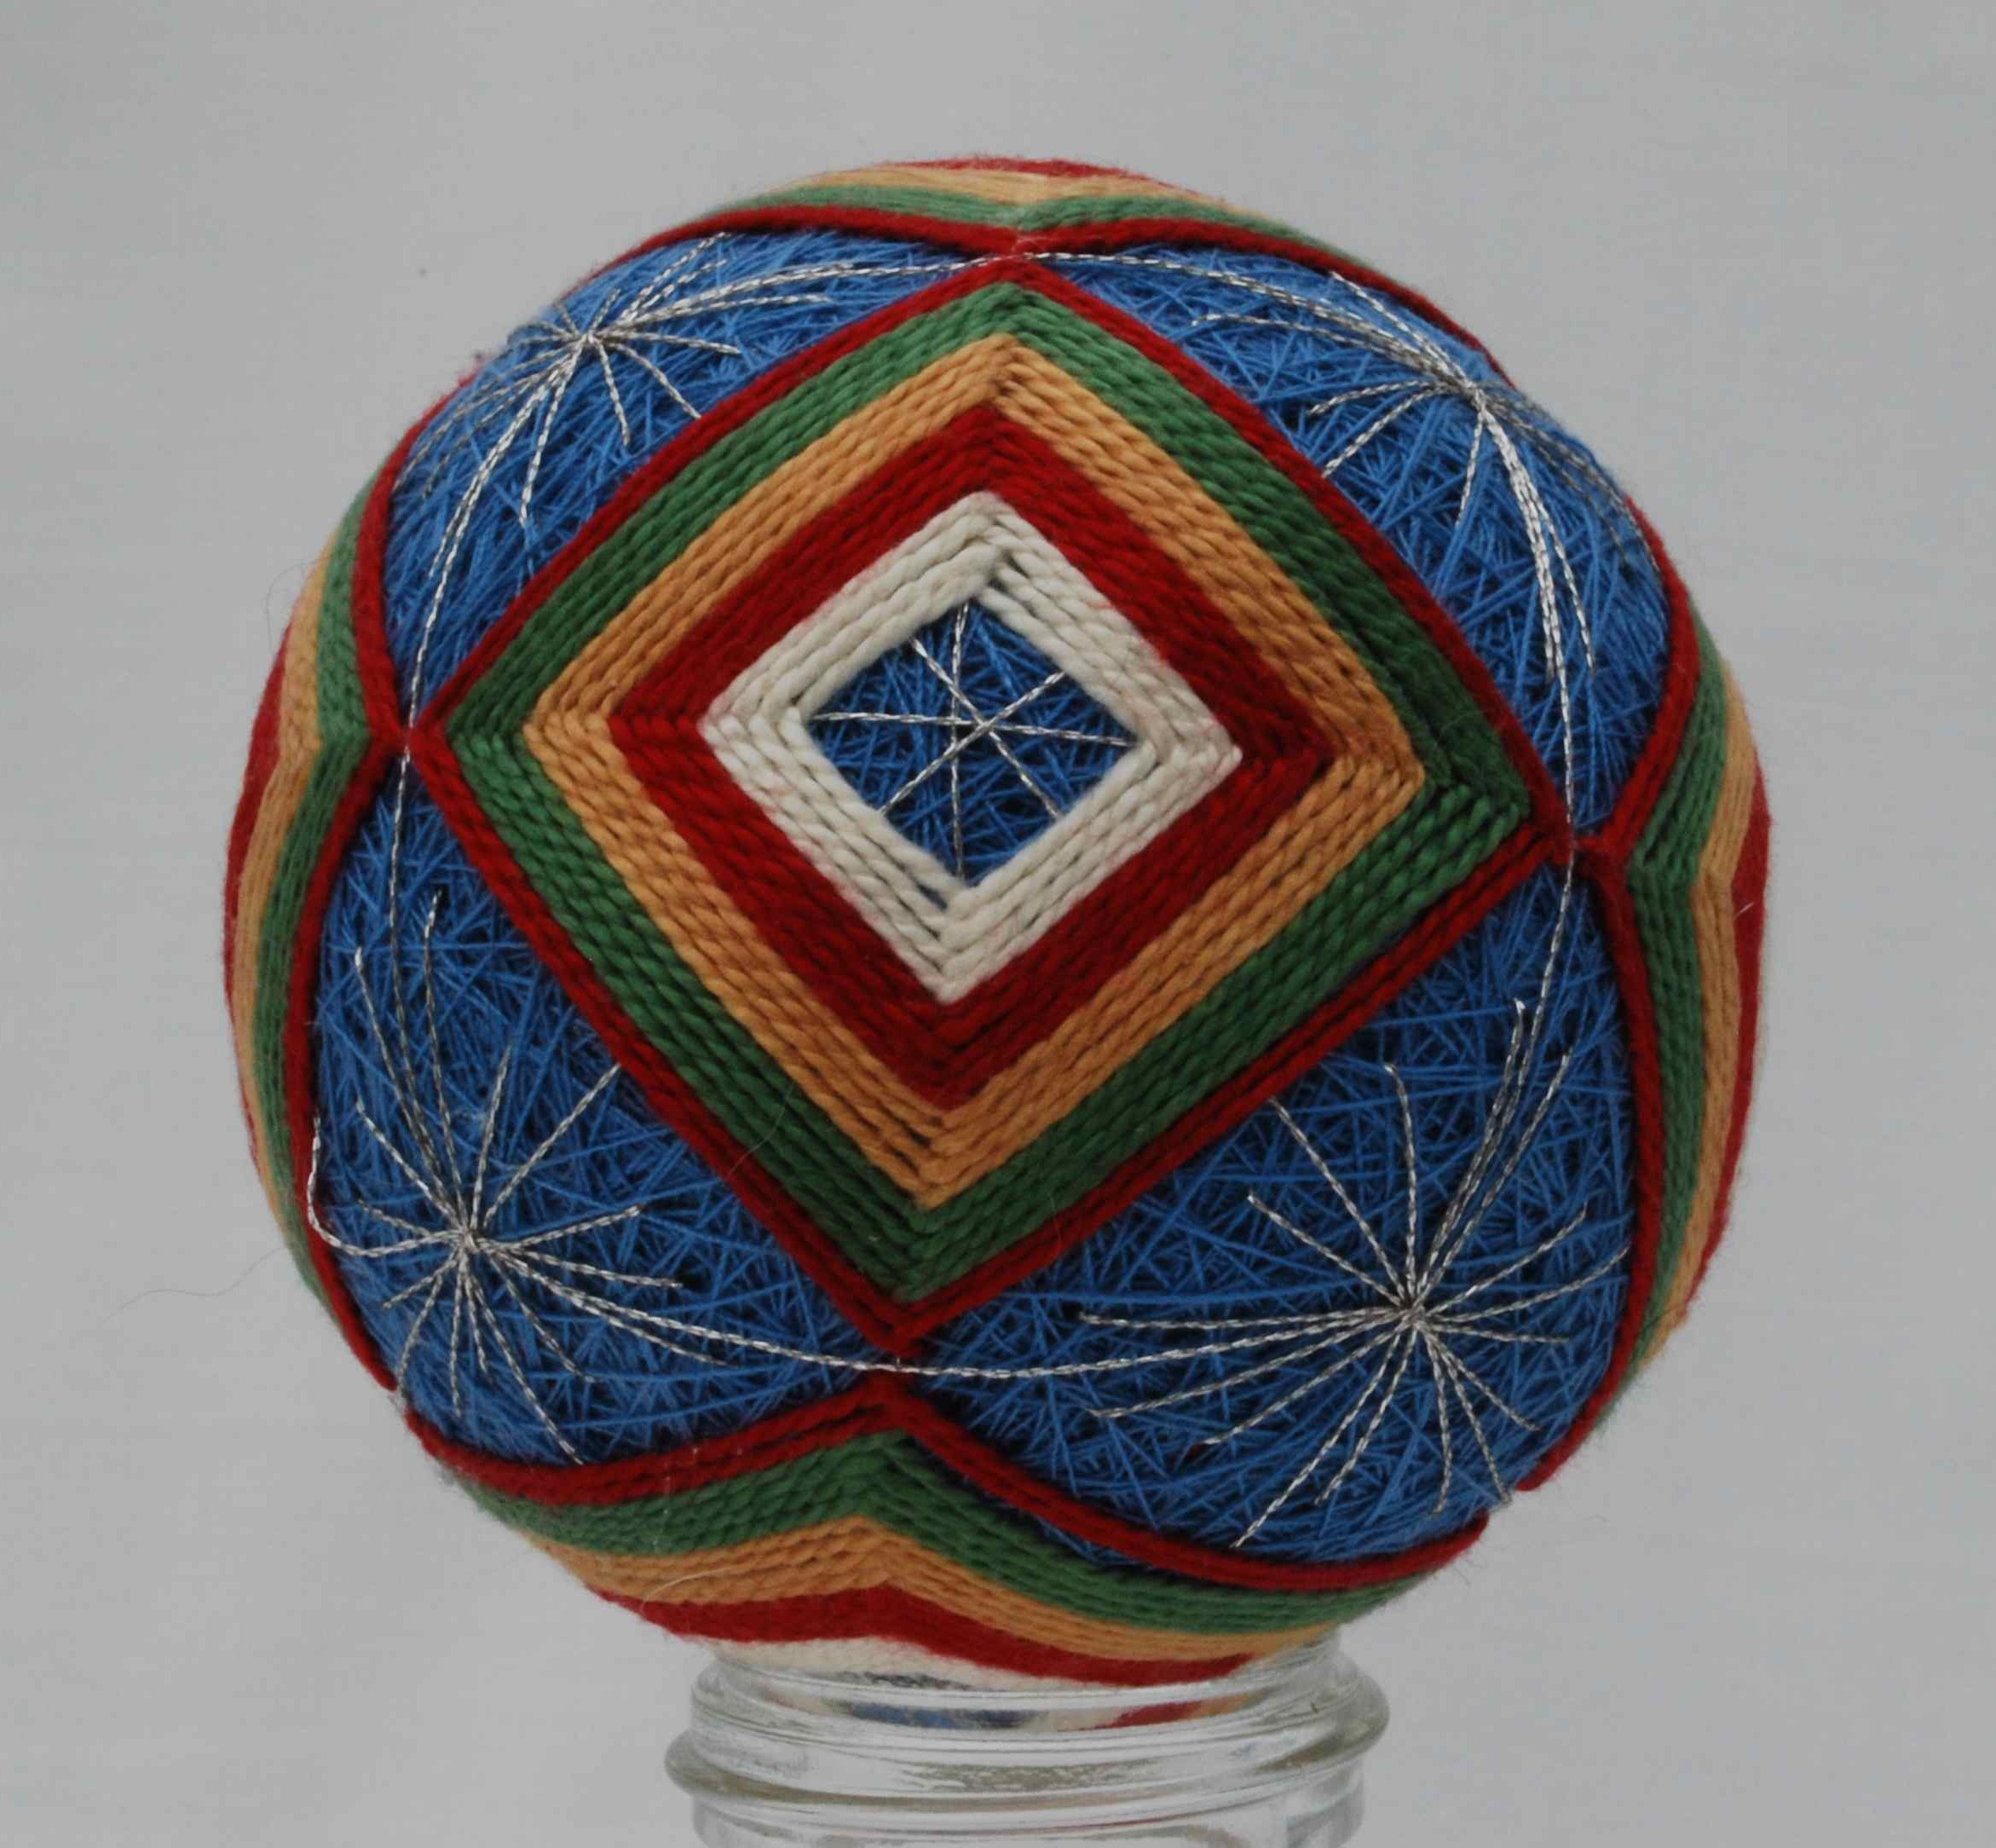
As Justin mentioned last week, the Math Munch team had a blast at the MOVES conference last week.  I met so many lovely mathematicians and learned a whole lot of cool math. Let me introduce you to Carolyn Yackel. She’s a math professor at Mercer University in Georgia, and she’s also a mathematical fiber artist who specializes in the beautiful Temari balls you can see below or by clicking the link. Carolyn has exhibited at the Bridges conference, naturally, and her 2012 Bridges page contains an artist statement and some explanation of her art.
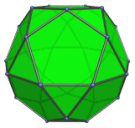
temari15 temari3 temari16

Icosidodecahedron

Icosidodecahedron

Truncated Dodecahedron

Truncated Dodecahedron

Cuboctahedron

Cuboctahedron

Temari is an ancient form of japanese folk art. These embroidered balls feature various spherical symmetries, and part of Carolyn’s work has been figure out how to create and exploit these symmetries on the sphere.  I mean how do you actually make it that symmetric? Can you see in the pictures above how the symmetry of the Temari balls mimic the Archimedean solids? Carolyn has even written about using Temari to teach mathematics, some of which you can read here, if you like.

Read Carolyn Yackel’s Q&A with Math Munch.


Edmund Harriss

Edmund Harriss

Up next, you may remember Edmund Harriss from this post, and you might recall Desmos from this post. Well the two have come together! On his blog, Maxwell’s Demon, Edmund shared a whole bunch of interactive graphs from Desmos, in a post he called “Form Follows Function.” Click on the link to read the article, and click on the images to get graphs full of sliders you can move to alter the images. In fact, you can even alter the equations that generate them, so dig in, play some, and see what you can figure out.

graph2 graph1 graph3

Finally, I want to share a piece of music I really love. “Clapping Music” was written by Steve Reich in 1972. It is considered minimalist music, perhaps because it features two performers doing nothing but clapping. If you watch this performance of “Clapping Music” first (and I suggest you do) it might just sound like a bunch of jumbled clapping. But the clapping is actually built out of some very simple and lovely mathematical patterns. Watch the video below and you’ll see what I mean.

Did you see the symmetries in the video? I noticed that even though the pattern shifts, it’s always the same backwards as forwards. And I also noticed that the whole piece is kind of the same forwards and backwards, because of the way that the pattern lines back up with itself. Watch again and see if you get what I mean.

Bonus: Math teacher, Greg Hitt tweeted me about “Clapping Music” and shared this amazing performance by six bounce jugglers!!!  It’s cool how you can really see the patterns in the live performance.

I hope you find something you love and dig in. Bon appetit!

MOVES, the Tower of Hanoi, and Mathigon

Welcome to this week’s Math Munch!

MOVESThe Math Munch team just wrapped up attending the first MOVES Conference, which was put on by the Museum of Math in NYC. MOVES is a recreational math conference and stands for Mathematics of Various Entertaining Subjects. Anna coordinated the Family Activities track at the conference and Paul gave a talk about his imbalance problems. I was just there as an attendee and had a blast soaking up wonderful math from some amazing people!

AnnaMOVES PaulMOVES JustinMOVES

Who all was there? Some of our math heroes—and familiar faces on Math Munch—like Erik Demaine, Tanya Khovanova, Tim and Tanya Chartier, and Henry Segerman, just to name just a few. I got to meet and learn from many new people, too! Even though I know it’s true, it still surprises me how big and varied the world of math and mathematicians is.

SuMOVES

Suzanne Dorée at MOVES.

One of my favorite talks at MOVES was given by Suzanne Dorée of Augsburg College. Su spoke about research she did with a former student—Danielle Arett—about the puzzle known as the Tower of Hanoi. You can try out this puzzle yourself with this online applet. The applet also includes some of the puzzle’s history and even some information about how the computer code for the applet was written.

danielle

Danielle Arett

A pice of a Tower of Hanoi graph with three pegs and four disks.

A piece of a Tower of Hanoi graph with three pegs and four disks.

But back to Su and Danielle. If you think of the different Tower of Hanoi puzzle states as dots, and moving a disk as a line connecting two of these dots, then you can make a picture (or graph) of the whole “puzzle space”. Here are some photos of the puzzle space for playing the Tower of Hanoi with four disks. Of course, how big your puzzle space graph is depends on how many disks you use for your puzzle, and you can imagine changing the number of pegs as well. All of these different pictures are given the technical name of Tower of Hanoi graphs. Su and Danielle investigated these graphs and especially ways to color them: how many different colors are needed so that all neighboring dots are different colors?

Images from Su and Danielle's paper. Towers of Hanoi graphs with four pegs.

Images from Su and Danielle’s paper. Tower of Hanoi graphs with four pegs.


Su and Danielle showed that even as the number of disks and pegs grows—and the puzzle graphs get very large and complicated—the number of colors required does not increase quickly. In fact, you only ever need as many colors as you have pegs! Su and Danielle wrote up their results and published them as an article in Mathematics Magazine in 2010.

Today Danielle lives in North Dakota and is an analyst at Hartford Funds. She uses math every day to help people to grow and manage their money. Su teaches at Ausburg College in Minnesota where she carries out her belief “that everyone can learn mathematics.”

Do you have a question for Su or Danielle—about their Tower of Hanoi research, about math more generally, or about their careers? If you do, send them to us in the form below for an upcoming Q&A!

UPDATE: We’re no longer accepting questions for Su and Danielle. Their interview will be posted soon! Ask questions of other math people here.

MathigonLast up, here’s a gorgeous website called Mathigon, which someone shared with me recently. It shares a colorful and sweeping view of different fields of mathematics, and there are some interactive parts of the site as well. There are features about graph theory—the field that Su and Danielle worked in—as well as combinatorics and polyhedra. There’s lots to explore!

Bon appetit!

Bridges, Unfolding the Earth, and Juggling

Welcome to this week’s Math Munch – from the Netherlands!

I’m at the Bridges Mathematical Art Conference, which this year is being held in Enschede, a city in the Netherlands. I’ve seen so much beautiful mathematical artwork, met so many wonderful people, and learned so many interesting new things that I can’t wait to start sharing them with you! In the next few weeks, expect many more interviews and links to sites by some of the world’s best mathematical artists.

But first, have a look at some of the artwork from this year’s art gallery at Bridges.

Hyperbolic lampshade

By Gabriele Meyer

Bunny!

By Henry Segerman and Craig Kaplan

Here are three pieces that I really love. The first is a crocheted hyperbolic plane lampshade. I love to crochet hyperbolic planes (and we’ve posted about them before), and I think the stitching and lighting on this one is particularly good. The second is a bunny made out of the word bunny! (Look at it very closely and you’ll see!) It was made by one of my favorite mathematical artists, Henry Segerman. Check back soon for an interview with him!

Hexagonal flower

By Francisco De Comite

This last is a curious sculpture. From afar, it looks like white arcs surrounding a metal ball, but up close you see the reflection of the arcs in the ball – which make a hexagonal flower! I love how this piece took me by surprise and played with the different ways objects look in different dimensions.

Jack van WijkMathematical artists also talk about their work at Bridges, and one of the talks I attended was by Jack van Wijk, a professor from Eindhoven University of Technology in the Netherlands. Jack works with data visualization and often uses a mixture of math and images to solve complicated problems.

One of the problems Jack tackled was the age-old problem of drawing an accurate flat map of the Earth. The Earth, as we all now know, is a sphere – so how do you make a map of it that fits on a rectangular piece of paper that shows accurate sizes and distances and is simple to read?

myriahedronTo do this, Jack makes what he calls a myriahedral projection. First, he draws many, many polygons onto the surface of the Earth – making what he calls a myriahedron, or a polyhedron with a myriad of faces. cylindrical mapThen, he decides how to cut the myriahedron up. This can be done in many different ways depending on how he wants the map to look. If he wants the map to be a nice, normal rectangle, maybe he’ll cut many narrow, pointed slits at the North and South Poles to make a map much like one we’re used to. But, maybe he wants a map that groups all the continents together or does the opposite and emphasizes how the oceans are connected…crazy maps

Jack made a short movie that he submitted to the Bridges gallery. He animates the transformation of the Earth to the map projections beautifully.

Jack’s short movie wasn’t the only great film I saw at Bridges. The usual suspects – Vi Hart and her father, George Hart – also submitted movies. George’s movie is about a math topic that I find particularly fascinating: juggling! The movie stars professional juggler Rod Kimball. Click on the picture below to watch:

juggling

This is only the tip of the iceberg that is the gorgeous and interesting artwork I saw at Bridges. Check out the gallery to see more (including artwork by our own Paul and a video by Paul and Justin!), or visit Math Munch again in the coming weeks to learn more about some of the artists.

Bon appetit!