Tag Archives: art

The Numbers Project, Epidemics, and Cut ‘n Slide

Welcome to this week’s Math Munch!

It’s an end-of-the-year group post!

Brandon Todd WilsonPaul: This week I found Brandon Todd Wilson, a graphic artist who lives in Kansas City. He started a new and ambitious project. He wants to make a design for each of the numbers 0 through 365, making a new one each day of the year. That’s tough, but he’s done some amazing things so far. Check them out over at the numbers project. I’m amazed by the sneaky, clever ways he comes up with to showcase the numbers. Can you tell what numbers these three are below? Click to find out.

40 Screen Shot 2013-06-07 at 12.22.20 AM 118

Maybe you could try a numeric design of your own. Perhaps for your favorite number or your birthday. If you make something your proud of, email us at mathmunchteam@gmail.com, and we could feature your work on Math Munch!

[Here are some numeric creations inspired by Brandon’s!]

ninaAnna: Next up, it’s probably the end of the school year for most of you readers out there. Our school year is wrapping up, too. It’s sad, but also exciting, because we’re looking forward to what comes in the future. Recently, some of my students, looking to their futures, have been wondering what many students wonder: If I like math, what are some things I can do with it after I leave school? (We’ve posted about this question before – check out this post on the site We Use Math and any of the interviews on our Q&A page.) We here at Math Munch had the honor last week to meet an awesome woman who uses math all the time in her work as a scientist – Nina Fefferman!

green_virus_tNina works mainly as a biologist at Rutgers University in New Jersey researching all kinds of cool and interesting things relating to epidemiology, or the study of infectious diseases and how they spread into epidemics in groups of people. How does she use math? In everything! Since dealing with infectious diseases is best done before they become epidemics, scientists like Nina make mathematical models to predict how a disease will spread before it hits. These models are really important for governments and hospitals, who use them to figure out how they can prepare for possible epidemics.

Nina loves math and her work – and you can hear all about it in this TEDx talk she did in 2010.

Justin: Finally, check out this short video by Sander Huisman, of mathematical pasta fame:

Sander has some more great videos, too. The shape that Sander’s cut and slide pattern gets closer and closer to is called the twindragon. It’s related to the more famous dragon fractal. Notice how the area of the shape stays the same throughout the video. Thanks to the kind folks at math.stackexchange for helping me to identify this fractal so quickly!

An earlier stage and a later stage of my cut & slide exploration.

An earlier stage and a later stage of my cut & slide exploration.

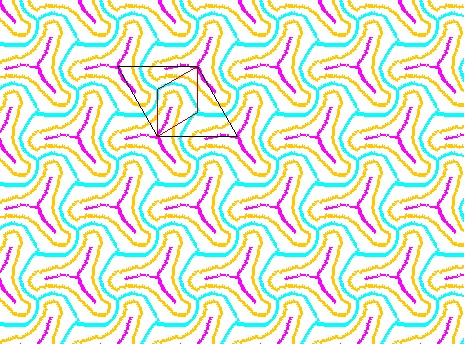
In searching about this geometry idea of “cut and slide”, I ran across some great stuff. One thing I found was this neat applet by Frederik Vanhoutte. (Warning: JAVA required.) Frederik is a med­ical radi­a­tion physi­cist who lives in Belgium and who likes to make wonderful graphics in his spare time. Frederik has shared many of these on his site—check out his portfolio.

On his About page, Frederik says this about why he makes his generative graphics:

“When rain hits the wind­screen, I see tracks alpha par­ti­cles trace in cells. When I pull the plug in the bath tub, I stay to watch the lit­tle whirlpool. When I sit at the kitchen table, I play with the glasses to see the caus­tics. At a can­dle light din­ner, I stare into the flame. Sometimes at night, I find myself behind the com­puter. When I finally blink, a mess of code is draw­ing ran­dom struc­tures on the screen. I spend the rest of the night staring.”

Bon appetit!

Solitons, Contours, and Thinking Sdrawkcab

Welcome to this week’s Math Munch!

Meet Nalini Joshi, a mathematician at the University of Sydney in Australia. I’ll let her introduce herself to you.

Nalini has an amazing story and amazing passion. What does her video make you think? To hear more from Nalini, you can watch this talk she gave last month at the Women in Mathematics conference at the Isaac Newton Institute in Cambridge, England. Her talk is called “Mathematics and life: a personal journey.” You might also enjoy reading this interview or others on her media page.

Nalini Joshi lecturing about solitons.

Nalini Joshi lecturing about solitons.

I’d like to share three clumps of ideas that might give you a flavor for the math that Nalini enjoys doing. Most of it is way over my head, but I’m reaching for it! You can, too, if you try.

Here’s clump number one. Two of the main objects that Nalini studies are dynamical systems and differential equations. You can think of a dynamical system as some objects that interact with each other and evolve over time. Think of the stars that Nalini described in the video, heading toward each other and tugging on each other. Differential equations are one way of describing these interactions in a mathematically precise way. They capture how tiny changes in one amount affect tiny changes in another amount.

Vlasov billiards.

Vlasov billiards.

To play around with some simple dynamical systems that can still produce some complex behaviors, check out dynamical-systems.org. Vlasov billiards was new to me. I think it’s really cool. The three-body problem is one of the oldest and most famous dynamical systems, and you can tinker around with examples of it here and here. There’s even a three-body problem game you can try playing. I’m not too crazy about it, but maybe you’ll enjoy it. It certainly gives you a sense for how chaotic the a three-body system can be!

Nalini doesn’t study just any old dynamical systems. She’s particularly interested in ones where the chaotic parts of the system cancel each other out. Remember in the video how she described the stars that go past each other and don’t destroy each other, that are “transparent to each other”? Places where this happens in dynamical systems are called soliton solutions. They’re like steady waves that can pass through each other. Check out these four videos on solitons, each of which gives a different perspective on them. If you’re feeling adventurous, you could try reading this article called What is a Soliton?

vid1

Making a water wave soliton in the Netherlands.

vid2

A computer animation of interacting solitons.

vid3

Japanese artist Takashi Suzuki tests a soliton to be used in a piece of performance art.

vid4

Students studying and building solitons in South Africa.

Level curves that are generalized Cassini curves. Also, kind of looks like a four-body problem. (click for video)

Level curves that are generalized Cassini curves.
Also, it kind of looks like a four-body problem.
(click for video)

The second idea that Nalini uses that I’d like to share is level curves, or contours. Instead of studying complicated differential equations directly, it’s possible to get at them geometrically by studying families of curves—contours—that are produced by related algebraic equations. They’re just like the lines on a topographic map that mark off areas of equal elevation.

Here’s a blog post by our friend Tim Chartier about colorful contour lines that arise from the differential equation governing heat flow. The temperature maps by Zachary Forest Johnson from a few weeks ago also used contour lines. And I found some great pieces of art that take contours as their inspiration. Click to check these out!

level_curves Utopia-70 Visual_Topography_of_a_Generation_Gap_Brooklyn_2

The last idea clump I’ll share involves integrable systems. In an integrable system, it’s possible to uniquely “undo” what has happened—the rules are such that there’s only one possible past that could lead to the present. Most systems don’t work this way—you can’t tell what was in your refrigerator a week ago by looking at it now! Nalini mentions on her research page that “ideas on integrable differential equations also extend to difference equations, and even to extended versions of cellular automata.” I enjoyed reading this article about reversible cellular automata, especially the section about Critters.

What move did Black just play? A puzzle by Raymond Smullyan.

What move did Black just play?
A puzzle by Raymond Smullyan.

And this made me think of a really nifty kind of chess puzzle called retrograde analysis—a fancy way of saying “thinking backwards”. Instead of trying to find the best chess move to play next, you instead have to figure out what move was made to get to the position in the puzzle. Most chess positions could be arrived at through multiple moves, but the positions in these puzzles are specially designed so that only one move will work. There’s a huge index of this kind of problem at The Retrograde Analysis Corner, and there are some great starter problems on this page.

Maurice Ashley

Maurice Ashley

And perhaps you’d like to hear a little bit about thinking backwards from one of the greatest teachers of chess, Grandmaster Maurice Ashley. Check out his TED video here.

I hope you’ve enjoyed finding out about Nalini Joshi and the mathematics that she loves. I asked Nalini if she would do a Q&A with us, and she said yes! Do you have a question you’d like to ask her? Send it to us below and we’ll include it in the interview, which I send to Nalini in about a week.

UPDATE: We’re no longer accepting questions for Nalini, because the interview has happened! Check it out!

Bon appetit!

World’s Oldest Person, Graphing Challenge, and Escher Sketch

265282-jiroemon-kimura-the-world-s-oldest-living-man-celebrated-his-115th-birOn April 19th, Jiroeman Kimura celebrated his 116th birthday. He was – and still is – the world’s oldest person, and the world’s longest living man – ever. (As far as researchers know, that is. There could be a man who has lived longer that the public doesn’t know about.) The world’s longest living woman was Jeanne Calment, who lived to be 122 and a half!

Most people don’t live that long, and, obviously, only one person can hold the title of “Oldest Person in the World” at any given time. So, you may  be wondering… how often is there a new oldest person in the world? (Take a few guesses, if you like. I’ll give you the answer soon!)

stackSome mathematicians were wondering this, too, and they went about answering their question in the way they know best: by sharing their question with other mathematicians around the world! In April, a mathematician who calls himself Gugg, asked this question on the website Mathematics Stack Exchange, a free question-and-answer site that people studying math can use to share their ideas with each other. Math Stack Exchange says that it’s for “people studying math at any level.” If you browse around, you’ll see mathematicians asking for help on all kinds of questions, such as this tricky algebra problem and this problem about finding all the ways to combine coins to get a certain amount of money.  Here’s an entry from a student asking for help on trigonometry homework. You might need some specialized math knowledge to understand some of the questions, but there’s often one that’s both interesting and understandable on the list.

Anyway, Gugg asked on Math Stack Exchange, “How often does the oldest person in the world die?” and the community of mathematicians around the world got to work! Several mathematicians gave ways to calculate how often a new person becomes the oldest person in the world. You can read about how they worked it out on Math Stack Exchange, if you like, or on the Smithsonian blog – it’s a good example of how people use math to model things that happen in the world. Oh, and, in case you were wondering, a new person becomes the world’s oldest about every 0.65 years. (Is that around what you expected? It was definitely more often than I expected!)

advanced 4

Next, check out this graph! Yes, that’s a graph – there is a single function that you can make so that when you graph it, you get that.  Crazy – and beautiful! This was posted by a New York City math teacher named Michael Pershan to a site called Daily Desmos, and he challenges you to figure out how to make it!  (He challenged me, too. I worked on this for days.)

qod0nxgctfMichael made this graph using an awesome free, online graphing program called Desmos. Michael and many other people regularly post graphing challenges on Daily Desmos. Some of them are very difficult (like the one shown above), but some are definitely solvable without causing significant amounts of pain. They’re marked with levels “Basic” and “Advanced.” (See if you can spot contributions from a familiar Math Munch face…)

30a2

Here are more that I think are particularly beautiful. If you’re feeling more creative than puzzle-solvey, try making a cool graph of your own! You can submit a graphing challenge of your own to Daily Desmos.

escher 3If you’ve got the creative bug, you could also check out a new MArTH tool that we just found called Escher Web Sketch. This tool was designed by three Swiss mathematicians, and it helps you to make intricate tessellations with interesting symmetries – like the ones made by the mathematical artist M. C. Escher. If you like Symmetry Artist and Kali, you’ll love this applet.

Be healthy and happy! Enjoy graphing and sketching! And, bon appetit!