Tag Archives: numbers

Mayans, Calendars, and Ramanujan

Welcome to this week’s Math Munch!

There’s been a lot of fuss recently about the Mayan calendar and the “end of the world.” You’ll be relieved to hear that the world continues to hang in there. In fact, no less an authority than NASA put out a video to help clear up the misinformation surrounding the rolling over of the Mayan calendar.

mayanAll of the doomsday talk did get me researching the Mayan calendar and number system. Check out this page that discusses Mayan numerals and will even count and skip-count for you. Once you’ve got the knack of how to count in the Mayan system, maybe you’ll want to try to decipher the numbers on a Mayan ballcourt marker in this interactive applet.

A cool fact that I learned from that first page is that the Mayans also had another and fancier way of writing down numbers: face glyphs. I found a really comprehensive article by Mark Pitts that describes both face glyphs and the ordinary system, too.

glyphs

The Mayan face glyphs for 0, 1, 2, and 3:
mih, jun, cha’, and ux.

There are many interesting kinds of calendars that human being have developed over the centuries, all with different styles, different mathematical patterns, and different connections to the natural and human worlds. We’ve featured the Cloctal before, but how about some links to some other fun mathy calendars as the new year approaches?

Thursday-January-1

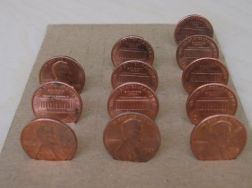
Thursday, January 1—in pennies.

I’m always amazed by what the internet produces when I dream up a search term like “binary calendar.” Perhaps you’ve seen a binary clock before—if not, check out this one—but I was delighted to find several different takes on a binary calendar served up by Google. Juan Osborne designed a binary calendar with all of the dates written out it a big colorful loop. Next, can you figure out the secret to this wooden binary calendar by Ken and Bobbie Ralphs? (It’s a lot like a marble calculator.) And third, here’s a binary calendar that you can make using just twelve pennies, courtesy of exploringbinary.com!

aztec-calendar-wheels

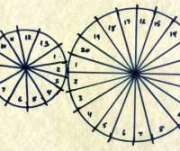
The Aztec tonalpohualli calendar.

There are many more amazing calendars to explore. Maybe you’ll check out Aztec calendar wheels, or find out about anniversaries of mathematicians from this calendar. (Isaac Newton was born on Christmas!) There are even more great calendars to explore at the Calendar Wiki, including some new calendars that have been proposed to “fix” our calendar—the Gregorian calendar—to get rid of traits like uneven months and leap years.

RamanujanSpeaking of anniversaries, this past Saturday was the 125th anniversary of the birth of the great Indian mathematician Srinivasa Ramanujan. Google celebrated the occasion with this doodle on the Indian Google homepage.

srinivasa_ramanujans_125th_birthday-992007-hp

Ramanujan’s story is inspiring and also in some ways tragic. There’s plenty of information about Ramanujan on the web, but you might particularly enjoy reading this recent tribute to him by Dilip D’Souza. One surprising fact I ran across is that one of Ramanujan’s formulas involving pi appeared in (of all places) the movie High School Musical.

formula

One of Ramanujan’s infinite series, which made an appearance in High School Musical.

Ramanujan’s 125th birthday this year became the occasion for India’s first National Mathematics Day. What a cool holiday! Here is a clip from Indian television that shows some Indian students honoring Ramanujan and doing some math.

I can’t understand everything that’s happening in the video, but it’s simply amazing to catch a glimpse of students on the other side of the world being excited about math. Also, you might notice that some of the students are figuring out cube roots of large numbers, while some others are shown figuring out what day of the week certain dates fell on. That’s a neat calendar-related feat that you can read more about here.

And just because it made me giggle, here’s a little bonus video.

Bon appetit!

Factorization Dance, Vanishing, and Storm Infographics

Welcome to this week’s Math Munch!

Think fast!  How many dots are there in this picture?

This beautiful picture comes to you from Brent Yorgey and Stephen Von Worley.  If you counted the dots, you probably didn’t count them one at a time.  (And, if you did, can you think of another way to count them?)  If you counted them like I did, you noticed that the dots are arranged in rings of five.  Then maybe you noticed that the rings of five are themselves arranged in rings of five.  And then, finally, you may have noticed that those rings are also arranged in rings of five!  How many dots is that?  5x5x5 = 125!

In this blog post, Brent describes how he wrote the computer program that creates these pictures.  The program factors numbers into primes.  Then, starting with the smallest prime factor, the program arranges dots into regular polygons of the appropriate size with dots (or polygons of dots) at the vertices of the polygon.

Here’s how that works for 90.  90’s prime factorization is 2x3x3x5:

As Brent writes in his post, this counting gets much harder to do with numbers that have large prime factors.  For example, here is 183:

From this picture, I can tell that 183 has 3 as a prime factor.  But how many times does 3 go into 183?  It isn’t immediately clear.

When Stephen saw Brent’s creation, he decided the diagrams would be even more awesome if they danced.  And so he created what he calls the Factor Conga.  If you only click on one link today, click that one.  The Factor Conga is beautiful and totally mesmerizing.

For more factor diagrams, check out this post from the Aperiodical.  There’s a link to the factor diagram by Jason Davies that we posted about over the summer.

Next up, a few months ago we posted about the puzzles of Sam Loyd – one of which was a puzzle called Get Off the Earth.  In this puzzle, the Earth spins and – impossibly – one of the men seems to vanish.  This puzzle is a type of illusion called a geometrical vanish.  In a geometrical vanish, an image is chopped into pieces and the pieces are rearranged to make a new image that takes up the same amount of space as the original, but is missing something.

Here’s a video of another geometrical vanish:

No matter the picture, these illusions are baffling for the same reason.  Rearranging the pieces of an image shouldn’t change the image’s area.  And, yet, in these illusions, that’s exactly what seems to happen.

Check out some of these other links to geometrical vanishes.  Print out your own here.  And think about this: Are these illusions math – and, if it so, how?  I came across geometrical vanishes because a friend asked if I thought the Get Off the Earth puzzle was mathematical.  He isn’t convinced.  If you have any ideas that you think can convince him either way, leave them in the comments section!

Finally, the Math Munch team’s home, New York City, (and this writer’s other home, New Jersey) was hit by a hurricane this week.  The city and surrounding areas are still recovering from the storm.  Sandy left millions of people without power and many without homes.  One way people have tried to communicate the magnitude of what happened is to make infographics of the data.  Making a good infographic requires a blend of mathematics, art, and persuasion.  Here some of the most interesting infographics about the storm that I’ve found.  Check out how they use size, placement, and color to communicate information and make comparisons.

This infographic from the New York Times shows the number of power outages in the northeast and their locations in different states. The size of the circle indicates the number of people without power. Why would the makers of this infographic choose circles? Why do you think they chose to place them on a map? What do you think of the overlapping?

This is part of an infographic from the Huffington Post that compares hurricanes Sandy and Katrina. Click on the image to see the rest of the infographic. What conclusions can you draw about the hurricanes from the information?

This is a wind map of the country captured at 10:30 in the morning on October 30th, the day hurricane Sandy hit. The infographic was made by scientist-artists Fernanda Viegas and Martin Wattenberg. It shows how wind is flowing around the United States in real-time. Check out their site (click on this image) to see what the wind is doing right now in your part of the country!

To those in places affected by Hurricane Sandy, be safe.  To all our readers, bon appetit!

Harmonious Sum, Continuous Life, and Pumpkins

Welcome to this week’s Math Munch!

We’ve posted a lot about pi on Math Munch – because it’s such a mathematically fascinating little number.  But here’s something remarkable about pi that we haven’t yet talked about. Did you know that pi is equal to four times this? Yup.  If you were to add and subtract fractions like this, for ever and ever, you’d get pi divided by 4.  This remarkable fact was uncovered by the great mathematician Gottfried Wilhelm Leibniz, who is most famous for developing the calculus.  Check out this interactive demonstration from the Wolfram Demonstrations Project to see how adding more and more terms moves the sum closer to pi divided by four.  (We’ve written about Wolfram before.)

I think this is amazing for a couple of reasons.  First of all, how can an infinite number of numbers add together to make something that isn’t infinite???  Infinitely long sums, or series, that add to a finite number have a special name in mathematics: convergent series.  Another famous convergent series is this one:

The second reason why I think this sum is amazing is that it adds to pi divided by four.  Pi is an irrational number – meaning it cannot be written as a fraction, with whole numbers in the numerator and denominator.  And yet, it’s the sum of an infinite number of rational numbers.

In this video, mathematician Keith Devlin talks about this amazing series and a group of mathematical musicians (or mathemusicians) puts the mathematics to music.

This video is part of a larger work called Harmonious Equations written by Keith and the vocal group Zambra.  Watch the rest of them, if you have the chance – they’re both interesting and beautiful.

Next up, Conway’s Game of Life is a cellular automaton created by mathematician John Conway.  (It’s pretty fun: check out this to download the game, and this Munch where we introduce it.)  It’s discrete – each little unit of life is represented by a tiny square.  What if the rules that determine whether a new cell is formed or the cell dies were applied to a continuous domain?  Then, it would look like this:

Looks like a bunch of cells under a microscope, doesn’t it?  Well, it’s also a cellular automaton, devised by mathematician Stephan Rafler from Nurnberg, Germany.  In this paper, Stephan describes the mathematics behind the model.  If you’re curious about how it works, check out these slides that compare the new continuous version to Conway’s model.

Finally, I just got a pumpkin.  What should I carve in it?  I spent some time browsing the web for great mathematical pumpkin carvings.  Here’s what I found.

A pumpkin carved with a portion of Escher’s Circle Limit.

A pumpkin tiled with a portion of Penrose tiling.

A dodecapumpkin from Vi Hart.

I’d love to hear any suggestions you have for how I should make my own mathematical pumpkin carving!  And, if you carve a pumpkin in a cool math-y way, send a picture over to MathMunchTeam@gmail.com!

Bon appetit!