Tag Archives: big numbers

Squiggles, Spheres, and Taxes

Welcome to this week’s Math Munch!

Check out this cool doodle animation from the blog of Matt Henderson. Matt studied math at Cambridge as an undergrad and now does research on speech and language technology. His idea for a doodle was to start with an equilateral triangle and then encircle it with squiggles until it eventually turned into a square.

Matt Henderson

Matt Henderson

Matt’s triangle-to-square squiggle

Matt has all kinds of beautiful and intricate mathematical images on his blog, many of them animated using computer code. He made a similar squiggle-doodle that evolves a straight line into a profile of his face; an animation of rolling a ball on a merry-go-round; a million dot generator; and many more!

Along the same “lines” as Matt’s squiggle, Ted Theodosopoulos wrote an article in Peer Points reviewing a research paper by Stanford mathematician Ravi Vakil. The title of Ravi’s paper is “The Mathematics of Doodling.”

Ravi’s doodle

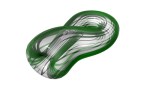
Next up, check out this cool visualization of a sphere.

The title of the video is Spherikal and was created by Ion Lucin, a graphic artist in Spain.

Something neat comes out about Ion’s attitude toward learning and sharing in a comment he makes:

“Thanks for appreciating my work. I was thinking the same, not to reveal my secrets, but then, i to learned from the videos and tutorials of others, i have been working with 3D for a year and a half, and all i know about it i learned it by myself, by seeing tutorials, im from fine arts. In a way a feel i must share , like other did and helped me”

What a great attitude!

Another spherical idea comes from a post on one of my favorite websites: MathOverflow, a question-and-answer site for research-level mathematicians…and anyone else! The question I have in mind was posted by Joe O’Rourke, a mathematician at Smith College and one of my favorite posters on MathOverflow. It’s about a certain kind of random walk on a sphere. Check it out!

For this step distance, it looks like a random walk will fill up the whole sphere. What about other step distances?

Again, such a cool picture is created by translating a mathematical scenario into some computer code!

Since this week is when federal income taxes are due, I’ll leave you with a few links about taxes and the federal budget. First, here’s the IRS’s website for kids. (Yes, for real.)

Next, this infographic lets you examine how President Obama’s 2011 budget proposal divvied up funds to all of the different departments and projects of the federal government. Can you find NASA’s budget?

2011budget

On a more personal scale, this applet called “Where did my tax dollars go?” does just that—when you give it a yearly personal income, it will calculate how much of it will go toward different ends.

Finally, this applet lets you tinker with the existing tax brackets and see the effect on total revenue generated for the federal government. Can you find a flat tax rate that would keep total tax revenue the same?

Whew! That was a lot; I hope you didn’t find it too taxing. Bon appetit!

Pentomino Puzzles, Knight’s Tours, and Decimal Maxing

Welcome to this week’s Math Munch!

Have a pentomino tiling problem that’s got you stumped?  Then perhaps the Pentominos Puzzle Solver will be right up your alley! Recently I’ve been thinking a lot about using computer programming and search algorithms to solve mathematical problems, and the Pentomino Puzzle Solver is a great example of the power of coding.  Written by David Eck, a professor of math and computer science at Brandeis University, the solver can find tilings of a variety of shapes.  Watch the application in slow-mo to see how it works; put it into high-gear to see the power of doing mathematics with computers!

Next, here’s a wonderful page about knight’s tours maintained by George Jelliss, a retiree from the UK.  He says on his introductory page, “I have been interested in questions related to the geometry of the knight’s move since the early 1970s.” George has investigated “leapers” or “generalized knights”—pieces that move in other L-shapes than the traditional 2×1—and he even published his own chess puzzle magazine for a number of years.  His webpage includes a great section about the history of knights tours, and I’m a fan of the beautiful catalog of “crosspatch” tours. Great stuff!

Multiplication, addition, division: which gives the biggest result?

Last but not “least”, to the left you’ll find a tiny chunk of a very large table that was constructed and colored by Debra Borkovitz, a math professor at Wheelock College.  Debra describes how, “Students often have poor number sense about multiplication and division with numbers less than one.”  She created an investigation where students decide, for any pair of decimals, which is biggest–multiplying them, adding them, or subtracting them.  For 1.0 and 1.0 the answer is easy–you should add them, so that you get 2.  .5 and 1 is trickier–adding yields 1.5, multiplying gives .5, but dividing 1 by .5 makes 2, since there are two halves in 1. Finding the biggest value possible given some restrictions is called “maximization” in mathematics, and it’s a very popular type of problem with many applications.

This investigation about makes me wonder: what other kinds of tables could I try to make?

Debra mentions that she got the inspiration for this problem from a newsletter put out by the Association of Women in Mathematics.  There’s lots to explore on their website, including an essay contest for middle schoolers, high schoolers, and undergraduates.

I hope you found something here to enjoy.  Bon appetit!

Number Gossip, Travels, and Topology

Thanksgiving was great, but I hope you saved room for this week’s Math Munch!

First up, meet Tanya Khovonova, a mathematician and blogger who works at MIT.  Number Gossip is a website of hers where you can find the mysterious facts behind your favorite numbers.  For instance, did you know that the opposite sides of a die add to 7, or that 7 is the only prime number followed by a cube (8=23)? Speaking of 7, I also found this cool test for divisibility by 7 on Tanya’s website.

Tanya Khovonova

Is that divisible by 7? Let's take a walk.

Read about how to use it here, but basically you follow that diagram a certain way, and if you land back at the white dot, then you’re number is divisible by 7. I’m amazed and trying to figure out how it works!

Infographic - Holiday Travel Patterns

Next up, I wanted to share this incredible picture I found today.  It’s an infographic showing travel patterns in the US during the holiday season.  The picture must represent millions of little pieces of data, so I’ve spent a lot of time staring and analyzing it.  Did you notice the bumps in the bottom?  Why is that happening?  Why are the blue lines different from the white lines? There are so many good things to be seen.

Finally, take a look at these pictures!  They’re from Kenneth Baker’s Sketches of Topology blog.  Kenneth makes images demonstrating ideas in topology, one of the most visually appealing branches of mathematics.  Some of it is tough to understand, but the pictures certainly are fascinating.

On a related point, have you taken a look at the Math Munch page of math games? (You can always find the link at the top of the column to the right.)  I just added a topology game, the Four Color Game, and I’m kind of loving it.  It’s based on a famous math result about only needing 4 colors to nicely color any flat map.  This is called the Four Color Theorem, and it’s a part of topology.

Bon appetit!